Types of Visuals and Their Communication Functions in eLearning

One of the main objectives of an eLearning course is to make a strong impact on learners that facilities learning. One of the ways to achieve this objective is by using visuals effectively. Before using them one should what are the different types of visuals and their communication function.
Types of visuals and their communication functions
Not just visuals but even their functionality is important for learning. Visuals can be divided into six categories and have different functionality to represent the various types of training content. The six categories of visuals are representational, mnemonic, organizational, relational, transformational and interpretive visuals (Source: Graphics in learning by Ruth Colvin Clark). Let’s look into the communication functionality of each one of them.
1. Representational Visuals
Representational visuals are the most common visuals seen in training modules. As the name suggests, representational visuals are intended to depict the actual appearance of content. They are appropriately used to present concrete concepts and factual information related to job tasks. They can be real photographs of any concept or screen shots of a software being taught. Here we can see the photograph of Airport.

2. Mnemonic Visuals
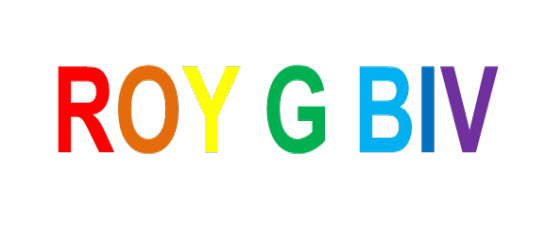
Occasionally employees may have to recall factual information when a job aid is not provided. In such a situation mnemonic visuals are very helpful and are a proven memory device. Here is an example of a mnemonic which is helpful to recall the seven colors in the rainbow in its correct order.

3. Organizational Visuals
Organizational visuals helps your learner to understand the order of the course. They establish qualitative relationships among the key concepts of the course. The visual here shows the overview of the content and its sequence making it clear for the learners.

4. Relational Visuals
Relational visuals establish quantitative relationships. Some common examples include bar graphs and pie charts. Instead of dumping paragraphs filled with numbers and percentages to show factual information, relational visuals can be effectively used to present the same in a clear and precise manner.

5. Transformational Visuals
Transformational graphics are used to depict the movement or changes over time and are often used in combination with representational visuals to illustrate procedures and processes. Here we used a visual of a caterpillar transforming to a butterfly and representational visuals are used to show the transformation.

6. Interpretive Visuals
Interpretive visuals helps learners in understanding the concepts or principles. When explaining an abstract concept like DNA, interpretive visuals are used to make the concept clear and understandable.

These are the six categories of visuals and each category has specific communication functionality, so choose the right category to achieve effective communication. Have anything to say please do share!


![eLearning Design Tips to Improve Learning Outcomes [SlideShare]](https://blog.commlabindia.com/hubfs/Imported_Blog_Media/elearning-design-tips-better-learning-outcomes-slideshare.jpg)
