How to Use Visuals for Effective E-Learning

In general, training materials contain loads of text that are presented using bulleted points. Not only are bulleted lists boring, they do very little to help learners remember information. As Instructional Designers (IDs), our job is to make learning easy and effective.
→ Download Now: State of Learning (Now and Beyond) [eBook]
Multimedia Principle states that people learn more deeply from words and pictures than from words alone.
Visuals play a crucial role in instructional design, helping learners understand and remember information faster and more effectively. Visuals support psychological learning process. Visuals are the iconic mental representations of what is being perceived. They often combine text, illustrations, and colors. Visuals are extremely effective in helping learners retain information and apply it on their jobs. Ruth Calvin Clark and Chopeta Lyons, in their book ‘Graphics for Learning’, explain the various types of graphics and how to use them for effective learning.
In this blog, I’m going to share my experience of using different types of visuals alongside instructional design strategies to enhance learning content.
Types of visuals and their functions
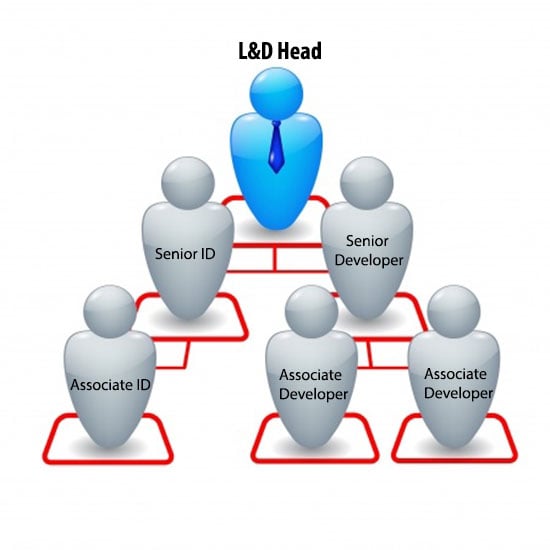
1. Organizational visuals
These visuals show the qualitative relationship between different elements. They can be used to explain a hierarchy of elements and how each one is related to the other.
E.g. Hierarchy in an organization

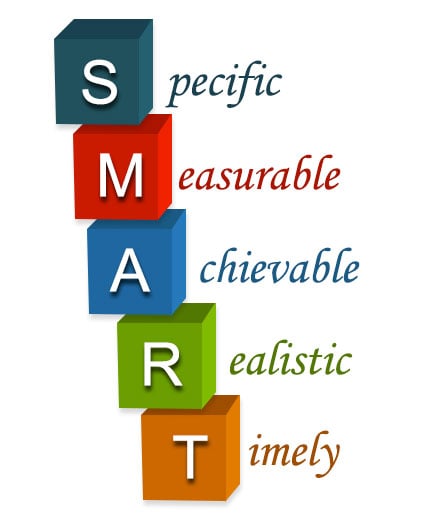
2. Mnemonic visuals
These visuals work as memory-aids and help the learner recall the information easily. They help him recall the factual information in the absence of a job-aid.
E.g. Goal setting (SMART goals)

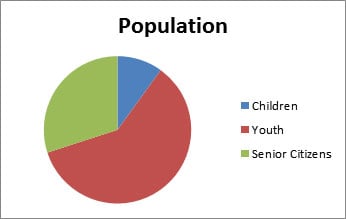
3. Relational visuals
These visuals communicate the quantitative relationship between elements. They help the learners get the complete picture at a glance.
E.g. Population and their age groups

4. Transformational visuals
These visuals communicate changes in time or space. They depict the evolution of an object, how it was and how it has changed during the time.
E.g. Steps of safe lifting

5. Interpretive visuals
These visuals communicate abstract cause-and-effect relationships between elements. These can be in the form of animations which show elements gradually changing to depict the effect.
E.g. Drink-driving leads to death

6. Static line drawings
These visuals illustrate how things look or how they work. There can be a series of static line diagrams to depict a complete concept.
E.g. How cloud computing works

Visuals are a powerful tool in instructional design. When used effectively, they support learning and aid recall. Instructional design principles emphasize the importance of using appropriate visuals to enhance understanding and avoid decorative or irrelevant images that may distract or hinder learning. Always include meaningful visuals in eLearning courses while adhering to these principles to ensure effective learning outcomes.


