5 Step Process of Visualization for your eLearning

How do you visualize content? How do you imagine visuals for your eLearning courses? Do you step into the learner’s shoes to visualize the content? How do you think learners can understand the training content better?
Paul Martin Lester says “Something is happening. We are becoming a visually mediated society. For many, understanding of the world is being accomplished, not through words, but by reading images.”
Studies reveal that the human brain comprehends visuals faster than words. In general, training materials contain loads of text presented using bulleted points. In order to help learners retain the information and apply it on their jobs, visuals need to be used. They are extremely effective because they help learners grab information quickly and efficiently. Visuals support the psychological learning process.
Every visual element should contribute to education, not decoration. Visual elements that need to be considered at course level include:
- GUI
- Color palettes
- Screen size
- Fonts used for headers, sub-headings and body text
- Amount of white space used in the layout
- Type of graphics – illustrations, clip-arts, stock images, graphics, etc.
Visualization used at screen level include:
- Graphs
- Maps
- Tables
- Photographs/videos
- Diagrams/ drawings
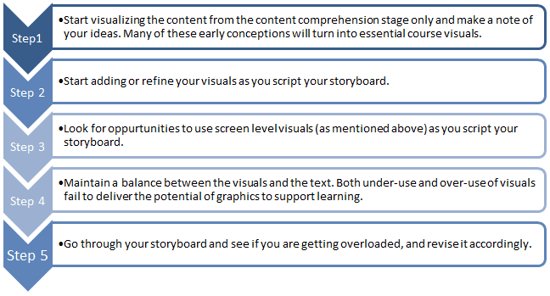
The 5 Step Process of Visualization
Let’s now see the 5-step process that we usually follow to visualize content.

This 5 step process of visualization helps create highly engaging online courses and deliver excellent learning experiences. Hope you find this post useful. How do you visualize learning content? We’d love to hear your experiences.


![10 Learning Design Strategies to Engage Learners [Infographic]](https://blog.commlabindia.com/hubfs/Imported_Blog_Media/ten-learning-design-strategies-infographic.jpg)

![How Does an LMS Ease Training Management? [Infographic]](https://blog.commlabindia.com/hubfs/Imported_Blog_Media/lms-to-ease-training-management-infographic.jpg)