6 Types of Visuals That Online Courses Accommodate
This blog discusses the six types of visuals that can be used in e-learning courses.

As discussed in my previous blog, “The Power Visualization Adds to E-learning“, visuals aid quick knowledge transfer and reinforce information as they target learners’ long-term memory. Once learning gets stored in long-term memory, your efforts to teach your learners are successful.
This blog discusses the six types of visuals that can be used in e-learning courses. These include Representational visuals, Mnemonics, Organizational visuals, Relational visuals, Transformational visuals, and Interpretive visuals. They add value to online courses by reducing cognitive overload and relieve learners of text-heavy content and support their memory by using striking visuals that linger in their memories for longer time periods. Let’s look at the types of visuals in detail.
1. Representational Visuals
These visuals depict the actual content and are used to present tangible concepts and factual information.They can be either real photographs of concepts or screen captures of the software being taught.Since these visuals are real, your employees can relate to them swiftly and easily. This helps in the immediate application of learning at the workplace.

2. Mnemonics
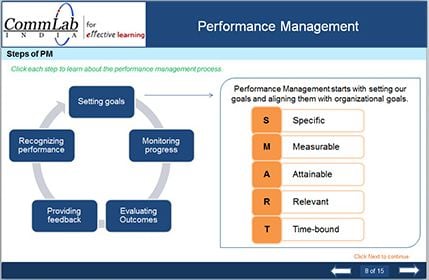
At times, when employees need to recall factual information in the absence of a job aid, mnemonic visuals come to their rescue.Mnemonics are patterns or associations of alphabets, used to aid memory recall. As you can see in the example below, a mnemonic makes it easy to recall how goals should be set.

3. Organizational Visuals
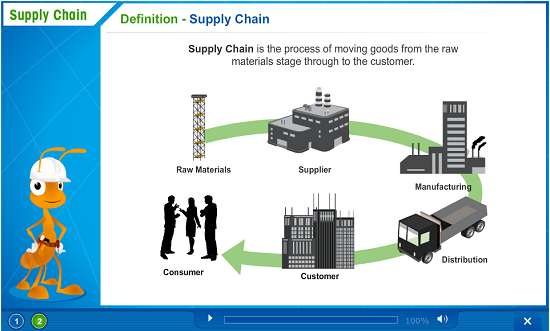
These visuals acquaint your learners with the flow of the course content. They establish qualitative relationships between the key concepts of the course, using text and shapes.Organizational visuals reduce undue loads of text and help learners get an overview of the content. The screenshot below depicts an organizational visual of supply chain management.

4. Relational Visuals
Relational visuals, unlike organizational visuals, establish quantitative relationships. Bar graphs and pie charts are forms of relational visuals.These visuals can be used effectively to replace text-heavy content that represents factual information in a precise, easy to understand and interpret manner.

5. Transformational Visuals
Transformational visuals are used to represent movement or changes that take place over time.They offer feedback, directions, and also support memory retention.These visuals are mostly used with representational visuals to demonstrate processes and procedures. Based on learners’ prior knowledge, you can use dynamic or static visuals. You can start with static visuals and then move on to animations.

6. Interpretive Visuals
Interpretive visuals are used to help learners understand abstract concepts or principles. For instance, an abstract concept such as DNA can be depicted better with interpretive visuals since they offer clear comprehension of the concept.

Now that you know which visual suits which type of content, you can select them easily to develop engaging, relevant online courses.Do you have anything to add? We welcome your views!


