Why Can’t You Skip Graphics in eLearning?
Though graphics in eLearning add aesthetic value, that’s not the sole purpose of a graphic. Find out why you can’t skip graphics in eLearning in this blog.

Can you have an eLearning course that’s just walls of text without graphics? You instantly reply ‘No’ without a doubt. Why is it so? Why can’t you skip graphics in eLearning courses? Here’s an attempt to answer that question, based on inputs from the book Graphics for Learning – Proven Guidelines for Planning, Designing, and Evaluating Visuals in Training Materials by Ruth Colvin Clark and Chopeta Lyons.
You can’t avoid the usage of graphics in eLearning. Why?
Graphics play a crucial role in eLearning because they:- Sustain learners’ attention
- Activate prior knowledge
- Minimize cognitive load
- Build mental models
- Support transfer of learning
- Motivate learners
1. Graphics in eLearning Grab and Sustain Attention
According to Gagne’s nine events of instruction, the first instruction is to gain attention of learners. Using graphics in eLearning is a great strategy to grab learners’ attention and help them focus on the training.
Here’s how you can grab and sustain learners’ attention in an eLearning course:
- Pay attention to the font type, size, and color of the text used in the eLearning course.
- Place text descriptions close to the visual. This may not always be possible in all slides of your eLearning course. In such cases, use rollovers or popups.
- Use attention-driving graphic elements such as arrows, icons, and animations (wherever relevant).
- To draw attention, use contrast colors or effects such as spotlighting, zooming in, or outlining.
Example to show the zooming in technique

2. Graphics Can Activate Prior Knowledge
Your learners will fall under one of these two categories:
- Experienced employees who have prior knowledge based on their work experience
- New hires with very little prior knowledge related to the content
For experienced learners, you can have an activity that tests prior knowledge and for new hires, you have to help them build a knowledge base so that they can understand the content of the training program.
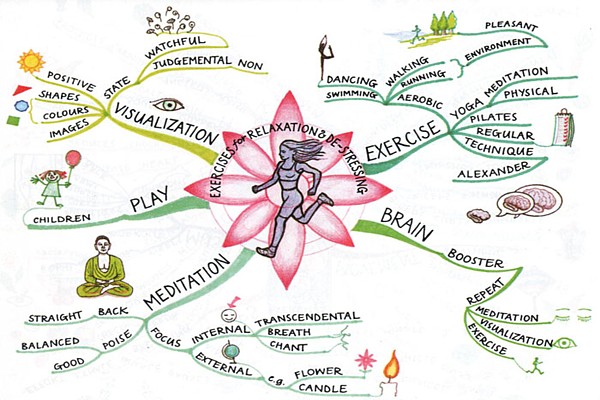
Graphics organizers can activate prior knowledge by helping learners visualize and understand content. Charts, comparison tables, Venn diagrams, mind maps, and concept maps are all examples of graphic organizers.
Here’s an example of a relaxation and de-stressing mind map. Take a look at how the prior knowledge of learners is activated using this simple graphic to tell them about the techniques to boost the brain and practice relaxation.
Source credit: https://www.mindmapart.com
3. Graphics Can Minimize Cognitive Overload
When our working memory is overloaded by a lot of information within a short span of time, it results in cognitive overload. Providing a lot of information in the form of text in an eLearning course, ends up overwhelming learners.
Here’s how you can plan for graphics in eLearning to reduce cognitive overload:
- Whenever possible, use illustrations and diagrams instead of chunks of text in your eLearning course.
- Represent procedures using visuals. For example, a simple step diagram or a flowchart to show the steps in a process is effective in eLearning.
- Follow a consistent graphical style in your eLearning course. For instance, there are times when a still image is better than an animation or an animation is better than a video. This would depend on the content of your eLearning course.
- When you use a complex animation in your eLearning course, support it with audio narration.
- In case of a complex graphic, present it by revealing layers or building the animation.
4. Graphics in eLearning Can Build Mental Models
It is possible to create mental models through visual thinking. Mental models are memory structures (also known as schemas) that are stored in long-term memory and facilitate thinking.
According to a Harvard Study in 2017, even when we are thinking verbally, visual images that relate to our verbal thoughts are created by our brain.
Here’s how you can use graphics in eLearning courses to build mental models:
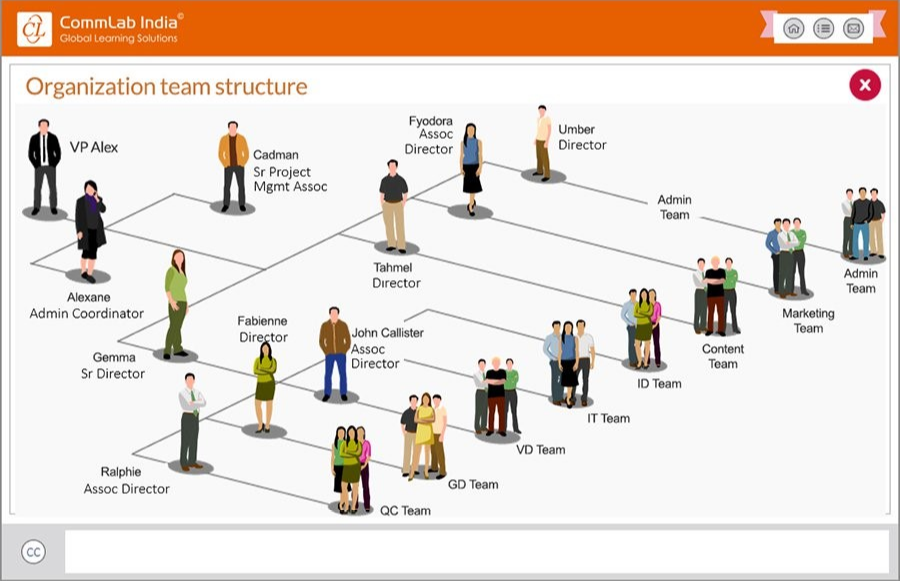
- When you have content on qualitative relationships that cannot be expressed as a number, use an organizational graphic. For example, using an organization chart to give new hires an overview of the hierarchical structure of the organization.
- When you need to teach quantitative relationships, use charts and graphs.
- To teach learners the changes over time and space, use a transformational visual such as an animation or a series of static visuals, line diagrams, or a video. This is generally used to show the steps in a process.
Here’s an example of a transformational visual that shows the steps to follow for safe lifting.

5. Graphics Can Support Transfer of Learning
The success of an eLearning course depends on how well learners have been able to apply the learning to their tasks at the workplace. To apply skills at the workplace, the mental models built in long-term memory need to be brought to the working memory. This process is called ‘retrieval’.
To explain this further, consider a software training program that uses simulations in eLearning. Here learners are able to view the various screens in the software and also practice the steps related to their job function using simulations. This makes it easier for learners to apply the learning in their real work environment. This wouldn’t be possible without a graphical simulation. You can also use scenarios to build relevance to the topic.

6. Graphics in eLearning Can Motivate Learners
There is no doubt that using graphics in eLearning makes learning more interesting than relying entirely on text. There is enough research to prove that graphics can trigger interest in learners and motivate them to learn.
Consider an example where you have to teach learners how to troubleshoot a product. Give them steps to troubleshoot in the form of text or provide a video that shows an expert performing the troubleshooting steps. Learners would naturally be inclined toward the second method of learning because not only is watching the video interesting but also, they are able to relate it to their work-context.
The next time you think of adding a graphic to your eLearning course, spend some thought identifying how it’s going to enhance the learning experience. A thumb rule to apply is to use graphics that are relevant to the content and resist the temptation to add eye-catching graphic elements in your eLearning course that serve as mere decorative elements just to make the course appealing.


